Choose colours by the meaning of the data
Use distinct hues for unordered categories such as departments. Keep a department’s colour consistent between charts. Use a light-to-dark scale for ordered quantities such as low-to-high utilisation, rather than assigning unrelated hues to every value.
In a theme, dataColors supplies series colours. It does not automatically turn a measure into a sequential scale. Configure the visual’s conditional formatting with the intended bounds; the sequential example supplies minimum, center, maximum and null colour defaults as a starting point.
Download a starting palette
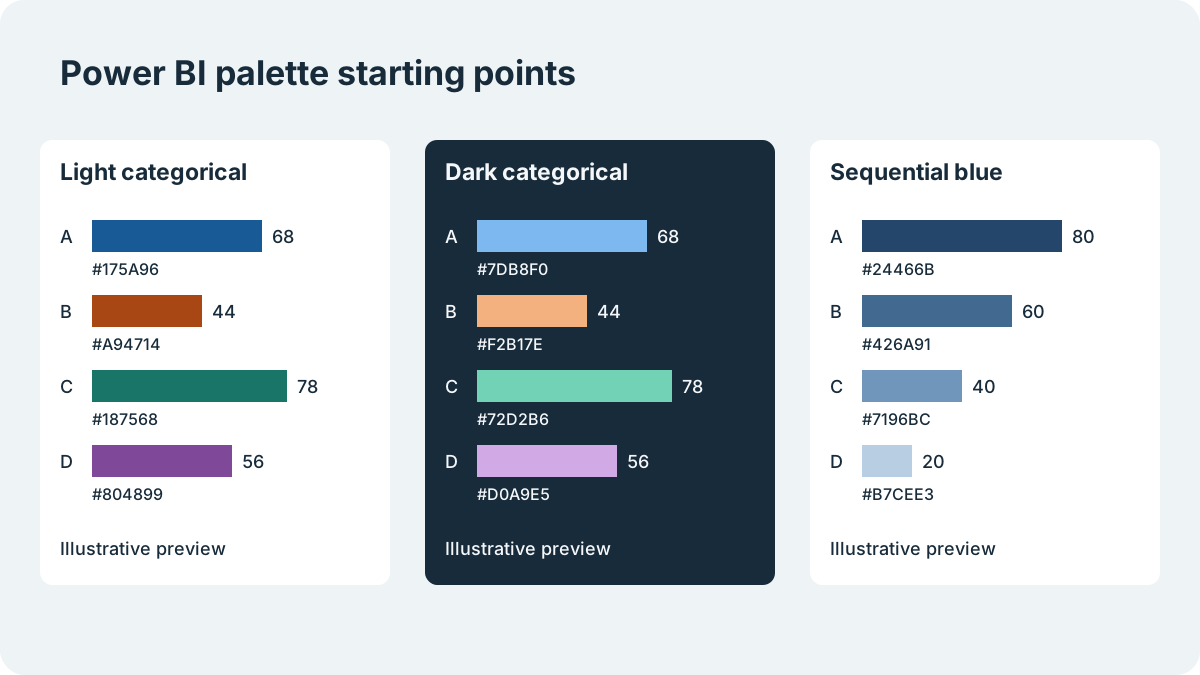
Each file is a minimal JSON theme, not a complete report design. Use the light categorical example for a few separate groups, the dark example when the whole report is designed for a dark canvas, and the sequential example for ordered values. The latter contains light colours that need particular care on white backgrounds.
The files are checked against the schemas bundled with the PageUtil validator. That confirms the JSON structure, not how every visual will look in your installed Desktop version.
Light categorical
Compare a few named categories on a light canvas.
Download Light categorical theme JSON
{
  "name": "PageUtil Light Categorical",
  "dataColors": [
    "#175A96",
    "#A94714",
    "#187568",
    "#804899"
  ],
  "background": "#FFFFFF",
  "foreground": "#172B3A",
  "tableAccent": "#175A96"
}
Dark categorical
Compare named categories on a dark report canvas.
Download Dark categorical theme JSON
{
  "name": "PageUtil Dark Categorical",
  "dataColors": [
    "#7DB8F0",
    "#F2B17E",
    "#72D2B6",
    "#D0A9E5"
  ],
  "background": "#172B3A",
  "foreground": "#F5F7FA",
  "tableAccent": "#7DB8F0"
}
Sequential blue
A light canvas with a blue scale for ordered values; configure conditional formatting explicitly.
Download Sequential blue theme JSON
{
  "name": "PageUtil Sequential Blue",
  "dataColors": [
    "#24466B",
    "#426A91",
    "#7196BC",
    "#B7CEE3"
  ],
  "background": "#FFFFFF",
  "foreground": "#172B3A",
  "tableAccent": "#24466B",
  "minimum": "#E4EDF5",
  "center": "#7196BC",
  "maximum": "#24466B",
  "null": "#D1D5DB"
}
Try the theme on a copy of your report
Download a file, validate any edits, then import it through Power BI Desktop’s report-theme controls. Test on a copy containing a bar chart, line chart, table, labels and the actual number of series you use. Existing visual-level overrides can hide changes made to a theme.
Check both bright and dim displays. The dark file sets colour defaults; it is not a promise that every existing page, visual or custom visual will acquire a dark background. If an import fails, use How to Fix Power BI Theme JSON Import Errors rather than changing colours at random.
Keep information readable without colour alone
Use Contrast Checker for the actual foreground/background pairs, especially labels placed inside coloured bars. A foreground colour that works on the canvas may fail on a series fill. Use direct labels, marker shapes or a data table so colour is not the only way to distinguish series.
A schema pass or a contrast score does not prove colour-blind usability. Check a colour-vision simulation and review the report with its intended readers. For crowded legends, reduce the number of simultaneously displayed categories instead of endlessly extending the palette.
References
Use the linked specifications and product documentation to check behavior in your own environment.
Continue troubleshooting
Related tools
Frequently asked questions
What are good colour combinations for a Power BI report?
Use distinct hues for a few named categories and an ordered light-to-dark scale for numeric magnitude. Check labels, background contrast and series identification on the actual report.
Will changing dataColors recolour every existing visual?
No. Existing visual-level overrides and custom visuals can behave differently. Test representative visuals after importing a theme.
Are these themes certified accessible?
No. The JSON examples are schema-checked starting points. Accessibility depends on the rendered report, labels, interactions, contrast and whether readers can distinguish data without colour alone.